Showing posts with label monsoon. Show all posts

12 May 2010

Margot's science outreach: temperature!

It’s been a while! Time for more science outreach. I explained my first monsoon paper, which has most of the background information, here, and the second one, in which I actually do reconstruct monsoon, here. Time now to move further back in time! Time to elaborate on my article “Saher, M.H., Rostek, F., Jung, S.J.A., Kroon, Bard, E., D., Schneider, R.R., Greaves, Ganssen, G.M., M. and Elderfield, H.: Sea Surface Temperature in the western Arabian Sea in the penultimate and last interglacial: a comparison of UK’37 and Mg/Ca paleothermometry. Paleoceanography, Vol. 24, PA2212, doi: 10.1029/2007PA001557, 2009”.


Both papers I discussed before go no further than 20.000 years, and there’s more to life. In the first outreach blog post I already describe the use of the fossil record; if you only know what things are like in the last 20.000 years your knowledge is too narrow. Climate depends on boundary conditions, and there’s more possible variation in these than there is in the last glacial-interglacial cycle. And now the time has come to go have a look at the previous one! But before I get to disclosing my monsoon reconstruction, and its implications, I have to elaborate on some background again. And not only for that reason; the article with the monsoon reconstruction in it is not yet published... it’s not even submitted. I regret that; I’m impatient! But I have a very overworked co-author, and it just takes long.

So what did I do before I got underway with the monsoon? I ended up on the side track of proxy evaluation. Proxies being the things we measure to indirectly find out what we want to know. We measure all kinds of things on the sediments and the microfossils we sieve out of them, but someone somewhere must have found out how these sediments relate to the environmental parameters we want to reconstruct. And generally, it turns out to be quite complicated. So there’s still lots of work being done on fine-tuning the proxies we have, and finding new ones. And I added to that body of work, by taking two ways of reconstructing sea water temperature, performing them on the same sediments, and seeing if they would give the same answers. And if not, try to find out why.

A random picture of a random machine used in proxy studies, in this case a spectrographer of Cambridge university

Something like “temperature” seems so straightforward. But is it? If someone writes “the temperature 128.000 years ago was 25°C”; what do they mean? Global annual average? At one meter above sea level, as modern temperatures are given, or somewhere else? And if they are more specific, and say things you are more likely to read in literature, such as “sea surface temperature in the South China Sea 135.000 years ago was 17°C”, it still is a bit ambiguous. I wonder if a surface technically can have a temperature. And would it be, again, an annual average?

Generally speaking, if someone writes about sea water temperatures they would mean the annual average temperature of the upper part (typically 50m) of the water column. If it is something else it would be specified. But if we read the information as documented in, for instance, the shell of a foraminifer, would that information indeed give just that? Not very likely.

A lady about to measure temperature over a depth interval directly

All reconstructions have their own peculiarities. And they tend to not give you something as regular as the annual average over a spatial interval of nicely round figures. And that can be a problem, but it can also be an advantage. I already explained in the monsoon blogpost that we for instance use the different seasonal cycles of the various foraminifera species for monsoon reconstruction. If one lives only in summer and another one all the time you can reconstruct the difference between summer and annual average from measuring the species separately. A similar thing can be done with ocean stratification. Measure one species that lives in the upper 50m and one that lives 100m deep. If they contain the same signal, the whole water column down to 100m must have been mixed. And it may not be evident to everybody why water stratification matters, but I’ll get to that in some later blog post.

So what was it I did for that third article? I compared two methods. One is the already described method of Mg/Ca on planktonic foraminifera. The other one is new to this blog: it is alkenone unsaturation. Alkenones are organic molecules that a specific type of plankton, viz. coccolithophorids, seem to use to keep the contents of their cells at the right viscosity, or something like that. Coccolithophores, by the way, are algae with a calcite skeleton, and they are small but abundant; they produce about half the oxygen in our atmosphere (so maybe you should say “thank you, coccolithophorids!” next time you breathe in), they are what school board chalk is made of, and what the white cliffs of Dover are made of too. And their alkenones have 37 C atoms, and some of the bonds between them are double and some are not, and just how many of them are double depends on temperature. And the good thing is, that these alkenones are amazingly robust, and you can just leave them lying around on the sea floor for millions of years, and then still measure their (unaltered) number of double bonds.

These cliffs, on the Isle of Wight, are the same stuff as these near Dover.

So what did we expect to see, using both these methods? To be honest, we should not have had any noteworthy difference. The coccolithophorids (or cocco’s for short) responsible for the alkenones have, at least in modern days, a quite similar distribution in both time and space to our foraminifera. So they should be recording the same thing! And if they don’t, it might be due to the plankton behaving differently then compared to what they do now, and we might be able to find out how. That would then be excellent information for the interpretation of all records of these kinds.

So what did we see? Remember we were reconstructing the previous interglacial, and quite some time around it. So we expected to see the low temperatures of the end of that ice age, then the warming up to the interglacial, and then the stepwise descent into the next ice age. And both temperature records thus constructed indeed showed that. But not in the same way! The alkenones showed much higher temperatures over the whole period, and the glacial-interglacial differences were much smaller.

Our Mg/Ca temperature record showed us temperatures in the range that we expected. Glacial temperatures like these in the last glacial, and then the rise into the interglacial, which at its peak was a bit warmer than the Holocene, and then intermediate temperatures. So if the little critters had not been changing their preferences concerning when and where they live in the last 150.000 years, the last interglacial was what we largely already knew from literature.

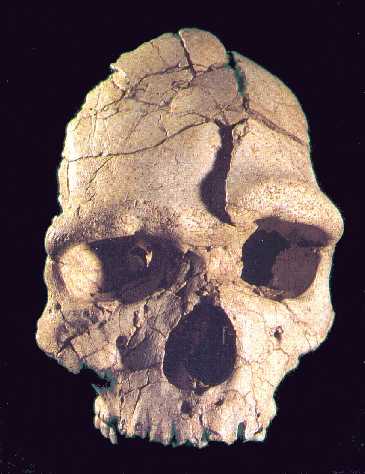
This is what human skulls looked like at the time. Picture taken from: www.talkorigins.org/faqs/homs/arago.jpg

Then the alkenones. High temperatures all the way! And to a certain extent that was expected; nobody knows why but they always give you higher temperatures than you can really explain. They magically seem to give annual average temperatures, even though they do not live in representative parts of the year! In our own core this offset is also seen in the last 20.000 years. But the difference in the previous interglacial is much bigger; 3.5°C on average. That’s much!

We first tried to explain this by assuming the alkenones were right, and the forams had just had a different preference in these times, but we didn’t manage; you would see a change in environment also in their isotopic composition, and there was nothing there.

Then we had to try the other way around. The forams were right and the cocco’s had changed! But that went wrong too. They could not reasonably have moved up in the water column, for they already live so shallow. It would be difficult to imagine them living in the warm intermonsoon season, as the whole reason it’s so warm is there is no water mixing, and that means no food.

We also considered disruptive mechanisms. Maybe the forams had been dissolving! Maybe the alkenones, which tend to be found in much finer sediments than the bulky forams, were just flushed in form elsewhere by some passing current. Maybe squirmy wormy things had been overturning the sediment, and misplaced interglacial alkenones in layers of glacial sediments! But there always was some argument against.

Arty picture of a brittle star; one of these creatures that is likely to disturb our beloved sediments

So in the end we had to give up. And since we can explain the foram-based record, but not the cocco-based record, we tend to believe the forams. The fact that cocco’s already had a shady image only strengthens our suspicions. But what would have been great would have been if we would have detected some change in environmental preference of one of our small creatures in the difference in temperature signal, and we haven’t. Too bad! Sometimes it just works out that way. At least now I have a better idea of how to evaluate temperature records of these kinds...

This article, by the way, was a difficult one to write. For most of the blog-readers the other names on the author list probably are just names, but of course there’s people behind them. Harry Elderfield happens to be a British Mg/Ca god, while Edouard Bard is a French alkenones god. One of them is a soft spoken, amiable man, while the other one is a genius who cannot stoop to the level of mortals, and often seems to die of impatience and indignation when confronted with the inferior utterings of those. And I was just a shy little PhD student. The article clearly sings the praise of forams, so I had to be very very careful in my wordings to get this article past the cocco man. And that would surely be the soft spoken, amiably man? Unfortunately not...

Edouard gave me a hard time on this one. If I had sent around a draft version, and I would see I had a response from him, I would always first breathe out slowly, gather all my courage, and then open the mail. And then let the shouting poor over me. But he was never unjust, and by whipping me so hard he managed to get everything out that I had in me. And it paid off; the article did get attention. It was top download of the journal for a while. And even though it did not deliver what we had hoped, I am actually above average proud of this one!

08 February 2010

Margot’s science outreach: monsoon!

I used almost 2000 words in the first science outreach blogpost, about my first article as a first author, which dealt with the background of my thesis work. I here bet I will need much less for a public version of my first article that actually dealt with the monsoon. The official reference is: Saher, M.H., Peeters, F.J.C. and Kroon, D., 2007. Sea surface temperatures during the SW and NE monsoon seasons in the western Arabian Sea over the past 20,000 years. Palaeogeography, Palaeoclimatology, Palaeoecology, 249(1-2): 216-228.


How do you get from two meter of mud to a 20.000 year monsoon record? The quick answer is: very expensive machines. The longer answer starts with what that “mud” actually consists of. Most of it is skeletons. Bleached, white skeletons, with gaping, toothless mouths. Serene remnants of feisty, dynamic beings. Of planktic foraminifera! What?

A live Ammonia tepida. Source: Creative Commons.

Foraminifera are animals consisting of one cell, which make an external skeleton. They come in all kinds of sizes and shapes. Thousands of different species of foraminifera live on the sea bottom, or even in tidal swamps. I’ll get to these later. Here I’ll focus on the few species that float somewhere in the sea; most of them in the upper 150 m. The so-called planktonic foraminifera. Together with all other life forms that float around, like the algae of the previous outreach blogpost, they are plankton. The most famous plankton is probably krill, but I think technically speaking it isn’t plankton but nekton, as they actively swim around. Anyway. Planktonic foraminifera; there’s only about 50 species of these. They are named after the holes in their skeletons, that in some species you can see under the microscope; foraminifera means “bearers of holes”. Through these holes they stick out their pseudopodia, that they use for catching food and such things.

For copyright reasons I direct people elsewhere for some cool pics of (dead) forams: have a look here

All species of planktonic foraminifera have their own preference of how deep they live, and in water of what temperature, and what sort of food they eat, and so on. And the brilliant thing with them is: when they grow their skeleton, the calcite it’s made of bears witness to these circumstances. One thing about the calcite (CaCO3) is that it contains oxygen, and oxygen has several stable isotopes. The “normal” isotope is 16O; 8 protons and 8 neutrons. There’s also very rare 17O, with an extra neutron, and even 18O, with 2 extra neutrons, is stable. And the fun is that due to their different masses these different atoms have slightly different properties. 16O, being lighter than 18O, evaporates easier. The ocean therefore has a higher percentage of 18O than clouds. And when clouds rain out, they preferably lose the heavy 18O. This in itself is already quite interesting; the further you go inland, the purer in 16O the rain will be, and if you for instance find some unidentified corpse somewhere you can just measure its oxygen isotopes, and that will tell you something about how far from the sea that person must have been living. But that’s a bit beside the point.


Schematic representation of the two mentioned oxygen istotopes. Source: NASA

So where was I? Oxygen isotopes. If you would evaporate lots and lots of water from the oceans, and not let it rain back, you would end up with an ocean with relatively much 18O. So where do you put all the 16O if you do that? There’s only one good storage place and that’s at high latitudes. In ice caps! If it ends up there it stays put for a while. So suppose you have 1 foraminifera skeleton from each year over hundreds of thousands of years, and you would measure the ratio of 18O and 16O in their calcite, you would see them get richer and poorer in 18O with the passing of the ice ages. And we took a few more every ~50 years instead of every single year, but the idea is the same.

Lots of 16O! In this case disguised as Strupbreen.

For some reason I'm not too sure of (maybe there are blog-reading physicists that would know!) the foraminifera (or forams,as they are colloquially known) take up less 18O when the water temperature is higher. They seem to prefer 16O, and maybe in cold water they lack the energy to be too picky, or something. Anyway, the sawtooth signal you get is not just a result of how much 16O is stored in ice sheets, but also temperature.

An effect I understand more of is more or less opposite; sometimes a foram will accidentally grab a magnesium atom instead of the more common calcium to use for the skeleton. And magnesium does not fit as well as calcium does. And at high temperatures your crystal lattice shakes and rattles so much you end up with these normally ill-fitting atoms anyway. And why that doesn't work for 18O I don't know but it just seems to be that way Anyway, the magnesium/calcium ratio seems to say something about temperature, and temperature only.

What is good to know here is that measuring the ratio of 18O and 16O in forams is much, much easier than measuring the magnesium/calcium ratio. For the former you just pick 30 forams of the same species (the same preferences!), crush them, and feed them into a mass spectrometer. Easy does it. For Mg/Ca measurement, you have to clean your samples really thoroughly. Any Mg-rich filth sticking to your foram will screw up your measurement. So you carefully crush the foram (which will typically be around 0.3 mm big), and then subject the shards to a very uncompromising cleaning regime. You keep on boiling your samples in unpleasant liquids, and picking out bits of pollution with a one-haired brush. Tedious.

The mass spectrometer on which I did all my isotopic measurements


So how does this all get us any closer to the monsoon? What is the monsoon, really? I mentioned it in the first monsoon blogpost: technically speaking it is not torrential rainfall, as it is used in colloquial speech, but a system of seasonally reversing winds. As these blow from the land in the one season and from the sea in the other, and these latter evidently bring all the moisture, these summer monsoon rains have pushed over the original meaning of the word. But we stick to the reversing winds. The location where my core was taken, the monsoon has a clear influence on sea water temperature. Coast-parallel winds combined with the rotation of the Earth make water either be pulled up or pulled down, and in the western Arabian Sea it happens to be the case that the summer monsoon winds pull water up and the winter monsoon winds push it down. And that is relevant for two reasons.

The cooling effect of the summer monsoon is really clear on this satellite image. Source: NASA

The first reason is food. Plankton is light-dependent, and can only live in the upper water column. If there’s food there all these little critters graze it away in no time. But food in the deep, and thus the dark, remains untouched, as they cannot reach it. But if the monsoon winds pull such water up, the nutrients become available. The summer monsoon season is therefore the period where there is most going on in the Arabian Sea.

The other thing is that the surface water temperature drops dramatically when this pumping starts. And that effect is clearly seen in the skeletons of the forams. Which prefer to grow then, as there is abundant food. In winter there are reasonable amounts of forams around, as the winter winds do accidentally stir some, but in the windless periods between the monsoons not much grows there.

And here comes the smart thing about my second article. What we now did is select one species of forams that mostly grows in summer, and one that grows both in summer and winter. We know how many of each tend to grow in each season. And we measured both species for 18O and 16O. And evidently, you don’t get the same results. That is, in some periods you do, but that then means the summer and winter were more or less the same. In some periods the year-round dweller has more 18O; a sign of cold winters. But the last ~8000 years, the summer dweller showed more 18O. So that was when the summer monsoon was strong enough to pump up the cold water!


The two species I used: on the left the summer bug, and right the all-rounder. Pics: Saskia Kars

And with only 18O you only know relative temperatures. This can be solved with Mg/Ca measurements. But what we then did, and that’s the smart part, we only did one species, for which we then had absolute temperatures. The temperature difference gives you the other one! Saves you lots of time and money. And in science, there is always a serious lack of both.

So what did we find? In our records, winter was colder between 20.000 and 13.000 years ago. As one would expect; 20.000 years ago, the last ice age was still ruling supremely. Between 13.000 and 8000 years ago, the difference between the seasons was small, mainly because winters were not as cold anymore. And then, kablang! At 8000 years the summer monsoon kicks in like mad. Like mad, as in, taking only a few hundred years, which we earth scientists think is really fast.

Heavy monsoon rains! Photo: the New York Times 

The fact that you see these three distinct periods, and not just a smooth increase of the summer monsoon at the expense of the winter monsoon, may indicate that there are two stable states of the monsoon system: the glacial and the interglacial state. The period in between looks like a bit of a transitional state. And the system can swap quite fast!

Monsoons are generally linked to the astronomical variability of the sun, but that is a very smooth cycle. Evidently, there are thresholds and feedbacks and such going on that moderate this forcing. And our record is not enough to unravel which ones, or how, exactly, but it in one more step in the right direction!


Ps Ha! That was only about 1650 words. I knew it! Maybe again a few hundred less for the next article…

10 January 2010

Margot's science outreach!

A few blogposts before ("Science and the general public") I promised to translate my published articles into something my blog readers, who may well have been the taxpayers on whom this all depends, can understand. And here it is: part I of Margot Leaves Esotery! And that word doesn't exist but it should. Anyways. Enjoy the user friendly version of what otherwise is called "Saher, M. H., S. J. A. Jung, H. Elderfield, M. J. Greaves, and D. Kroon (2007), Sea surface temperatures of the western Arabian Sea during the last deglaciation, Paleoceanography, 22, PA2208, doi:10.1029/2006PA001292."


There's glacials and interglacials, and they swap positions in a regular, predictable way, all over the globe, right? Just to name something: Salle Kroonenberg needs no more than 5 pages in his book "de menselijke maat" to reach the stage where he sees the need to point such a thing out. So we're in an interglacial now, we know how that happened, and we know when and how we will enter the next ice age. Or do we?

The whole idea of ice ages and interglacials is a fairly recent thing. If you have a damn long record of something that is an indication of climate you tend to have quite a mess until roughly 2 million years ago, when a fairly regular cycle appeared. Ice ages and interglacials came and went with a roughly 40.000 year period, the same frequency with which the Earth's tilt changes. That went on for quite a while, until roughly a million years ago, when the period changed to ~100.000 years, the frequency with which the Earth's orbit's ellipticity changes. This change is not yet entirely explained. Anyway, we've now had that new cycle for a while, and it's not particularly regular. It's not expected to be, really, as the earth is quite a complex system. There's lots of positive and negative feedback systems, there's chaos, there's all sorts of stuff to complicate things. Luckily some influences are well-known and predictable, most pronounced being the astronomical cycles. Check wikipedia in case you want a bit of an elaboration on them. I mentioned two already: eccentricity (ellipticity of the orbit) and obliquity (tilt). There's precession, too, and eccentricity is actually two cycles, the other one having a period of ~400.000 years. All these cycles matter, even though the 100.000 year cycle has been dominant for a while now. But we've hardly been through two periods of the (longer) eccentricity cycle, so it's difficult to really see how cyclic this cycle really is.

The present is key to the past, and the past is key to the future, as Lyell said. (At least he said half of that.) In order to understand the cycle we have to look back at previous interglacials, and the easiest one, of course, is the previous one. You don't have to drill too deep in order to get to these sediments, and they only had ~125.000 years to suffer from all sorts of disturbing processes that blur the signal. The best interglacial, however, is one three periods before that one, 400.000 years ago, as that one had all the astronomical cycles more or less the same as they are now. The previous interglacial does not at all have that. And as said before, we can hardly claim that what happens in a previous interglacial gives a solid guarantee on what will happen now, but it's the best we've got.

Unfortunately the sediment core I worked on for my PhD project did not cover that interglacial. It did cover the last 240.000 years. And I contended myself with this interglacial and the previous one. What did I want to find out? The development of the Indian monsoon, as this is a societally very relevant climate feature. Forget India if the monsoon fails. There's quite some Indians to forget if that happens. Finding out what really drives the monsoon will give us a chance to know what it will do in these recent times of anthropogenic climatic upheaval. And just studying the last decennia or centuries will not do; the system is now shaken up beyond anything we've seen in the Holocene. And CO2 levels actually are already way beyond anything we've seen ever since we've even had the glacial-interglacial cycle. We climate scientists have to work damn hard and be damn inventive to keep up with this, actually.

Anyway. We do what we can! And I studied the Indian monsoon. The monsoon, by the way, technically speaking is not torrential rainfall, as it is used in colloquial speech, but a system of seasonally reversing winds. As these blow from the land in the one season and from the sea in the other, and these latter evidently bring all the moisture, these summer monsoon rains have pushed over the original meaning of the word. But that aside. Reconstructing the monsoon requires some preparation. My first article hardly mentioned the monsoon. I basically presented the records I first constructed by means of framework.

What I did for my first article was tossing some dead plankton into some expensive machines that, as thanks, spat out two records, one of which providing (amongst others) a time frame, which we corroborated with 14C dating, and another one that gave a record of sea water temperature. These records spanned the last 20.000 years. The older part of the record is described in later articles. We had the end of the last ice age, the deglaciation, and most of the Holocene.

What did we find? The deglaciation started earlier than on most of the rest of the northern hemisphere, and it started with two distinct warm spells. The warmest period was, actually, the time of the the Younger Dryas, which is a strong cold spell in the middle of the deglaciation, found all over the place in the northern hemisphere. Strange! We compared our records with other regional records, and we added a record that gives a measure of organic production.


A map of the Arabian Sea, with in red the location of "my" core, and in white the locations of the cores I compared my results with.

We found out that the whole of the Arabian Sea tends to have this early onset of the deglaciation, but the records did not all show the same thing regarding the Younger Dryas. In some records this was a warm period indeed, but not in all. The record had low organic productivity in the warmest periods. Nowadays, plankton growth (the bulk of productivity) is strongest during the summer monsoon, as the summer monsoon winds mix the water column, and bring nutrients to the surface that otherwise would have stayed at such high depths that all light-dependent squirmy things living in the ocean could not reach them. And these low-productivity periods were at the same time as cold spells on the higher northern latitudes, and that was in line with other records from the area that contained productivity information.

So what does that mean? The Arabian Sea warms up before the ice age is over. This may mean it's the low latitudes that start the end of an ice age, and the ice caps don't go around melting on their own initiative. There's strange warm blips at the onset of the warming, which I will come back to. If the northern hemisphere is cold, for instance during the Younger Dryas, when massive ice melting weakened the gulf stream, the Arabian Sea may well lose lots of its productivity.

I realise I'm playing a dangerous game with cause and effect here. The Arabian Sea apparently starts things before the northern hemisphere ice sheets catch on, but that does not mean the Arabian Sea drives them. It does mean it's not the other way around. But you can always get positive feedbacks. So it's difficult (but probably not impossible!) to imagine that low productivity in the Arabian Sea would cause melting of Greenland ice. What is easy to imagine is heat from the Arabian Sea (which sneaks past South Africa into the Atlantic Ocean) melting Greenland ice, the fresh water weakening the gulf stream, that causing low temperatures over Europe, the cold somehow reaching the Tibetan Plateau (NB: weak point in the argument!), that weakening the summer monsoon, and that in turn leading to low productivity in the Arabian Sea, but not to a homogeneous Arabian Sea temperature effect as the summer monsoon does not influence the water temperature in the same way over the whole region. And from that description it is already clear we're not there yet, but maybe this illustrates how complex it all is, and how many records we need. I won't have to explain how many records from how many places you need to, for instance, figure out if the path I just described would indeed work that way. And think of all the things that are not mentioned here! For instance, if some nutter would cut down all the forests in Meso-America this may well hit the gulf stream hard too. And thus the rest of the world. And so on! Once you start, there's so much to consider.

Is what I found new? Sort of. There is no consensus yet on how we actually go from a glacial to an interglacial or back. There are records that suggest all kinds of things, but the picture is still incomplete, and this record gives its two cents. Two very detailed cents: when I published this record it had many times the resolution of all the other records from around there. These other records could not resolve things like my blips, let alone see how fast these things can happen.

The production of many records also helps to show how things relate to each other.Even before we figured out how this would work, we now have a warning, for instance, that if we exhaust lots of CO2, which leads to ice melting,we may be left with a warm and inproductive Arabian Sea. I have no idea how many people depend on Arabian Sea fisheries, and I actually do have an idea how much we western white rich people care about them anyway, but it's worth knowing. And science moves on: this was already published in 2007, and by now maybe somebody has come up with an explanation. And remember: this article is only the framework for the actual monsoon research that still is to come!


I thought I could summarise this paper in a few sentences. (One guy in Durham already suggested how: "I've done a lot of measurements, and it's all very boring, but don't worry!") How wrong! And I left so, so much out already. I hope that with leaving so much out it has remained understandable. And if not: shoot! This text can still be edited.

And another thing: some people who may have the patience to read this may also have my thesis. In its introduction I try to do something similar, digging deeper into things like methods and mechanisms, while in this text I try to place more emphasis on the relevance and the context. If anybody remembers the thesis well enough to reflect on to what extent the texts do or do not complete each other I would be grateful..